
19th Friday Fun Session (Part 1) – 26th May 2017
What is correlation?
Correlation measures whether two sets of variables are related and if yes, how strongly. For example, when rain increases in Singapore, temperature drops. So rain and temperature are negatively correlated. Negatively because, while one increases the other decreases. On the other hand, as job experience increases salary also increases. Hence the two are positively correlated. Let us consider a third case, I am cooking at home on weekends and that time you are running. As far as we understand there is no relation between the two. And hence there is no correlation.
What values does the correlation coefficient take?
Correlation is measured in terms of correlation coefficient. Correlation coefficient varies from -1 to +1. The value +1 means that the two variables are moving together in the same direction (both are increasing or both are decreasing) in the strongest possible way. To be precise, both variables are moving towards the same direction at the same magnitude. The value -1 means the same just that they are moving in the opposite direction. The value 0 means there is no linear relationship. Generally a value between -0.1 to +0.1 signifies no correlation.
How correlation coefficient is calculated?
Correlation is very important in data analytics. Hence it is not enough to know only the meaning of it but also how it is computed. What is the formula that brings out this relationship and how? While doing data analytics (for that matter doing anything) it always helps tremendously if we know underneath mechanism. It helps us to truly appreciate and understand its meaning, and the weakness and strength of it.
Rain and Temperature in Singapore
We take a few days’ small sample of rain and temperature data of April 2017 for Changi, Singapore where our JLTi office is located.
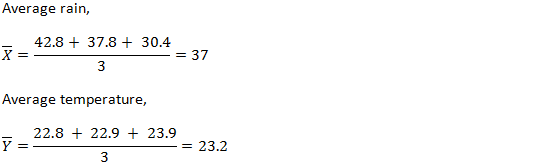
Rain in cm, X = (42.8, 37.8, 30.4) and corresponding temperature in Celsius, Y = (22.8, 22.9, 23.9). Looking at this data we can clearly see while rain increases, temperature always decreases, and vice versa. So there is a strong negative correlation here.
Average
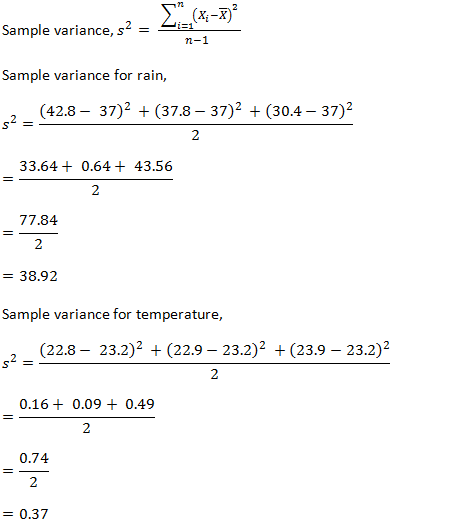
Sample Variance
Sample Standard Deviation

Sample Covariance
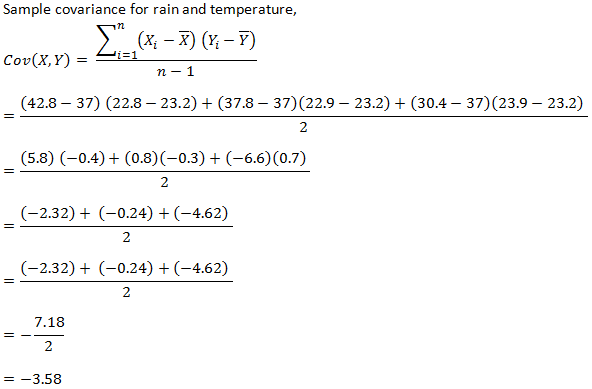
It is the covariance that tells how the two variables are moving together. A non-zero value (3.58) says that they are associated and when it is negative it says that they moving towards opposite direction.
We now need to understand how this value is calculated so that we get the intuition behind it.
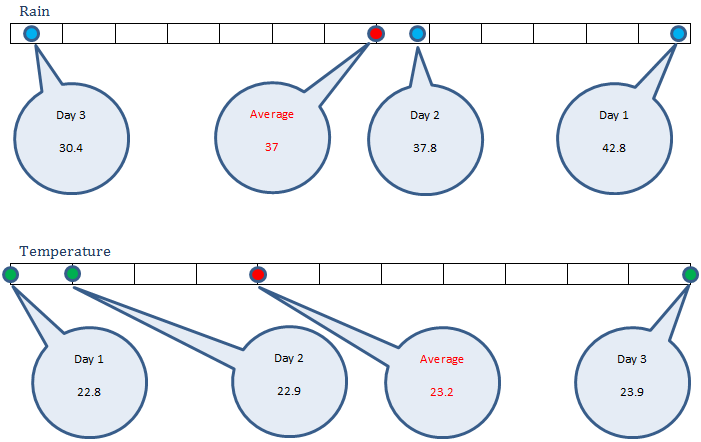
We are talking about two variables: rain and temperature, and whether they are associated or not. By that we mean to say whether on all the three days they moved and if yes, then to which direction. When we are talking movement, we measure it in terms of their respective average.
We see that on day 1, rain 42.8 cm was higher than average 37. On that day, temperature 22.8 degree Celsius was lower than average 23.2. That means: rain higher, temperature lower.
On day 2, rain 37.8 cm was higher than average 37. On that day, temperature 22.9 degree Celsius was lower than average 23.2. That means: rain higher, temperature lower.
On day 3, rain 30.4 cm was lower than average 37. On that day, temperature 22.9 degree Celsius was higher than average 23.2. That means: rain lower, temperature higher.
So in all 3 days both the variables moved from their respective averages and they moved towards opposite direction. The covariance formula captured exactly this. 3 components got added for 3 days. Each day the rain and temperature movement (difference with their respective average) was calculated and multiplied. Since they moved to the opposite direction in each of the three days, a negative value came from each of them in the calculation/formula.
Had they moved towards the same direction all the time, we would have got positive values from all of them resulting in a positive correlation.
Had any of them stayed on average without moving, for example, if on a day rain were 37 cm, same as rain average, there would not be any contribution to covariance. Since movement of one variable, rain would have been 0.
Had some of the days both moved in one direction and some of the days they moved in the opposite direction, then the first set would have given positive contribution and the later negative contribution, cancelling some or all of each other’s positive and negative contribution and in that process reducing covariance, rightfully indicating less association.
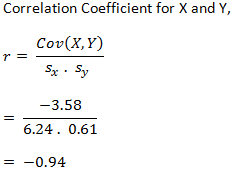
Sample Correlation Coefficient
Correlation is, in a sense a normalized form of covariance. We normalize by dividing covariance by the standard deviations of the two variables. Doing so makes sure it stays between -1 to +1. This helps when we want to understand the strength of the relation. It also helps when we want to compare two different correlations, say which correlation is stronger: correlation between somebody’s height and weight, or correlation between Singapore’s rain and temperature.
Why did we add a Sample before all?
We used the term Sample before many of the terms, like sample variance, sample standard deviation, sample covariance, and sample correlation coefficient. Why? Well, we have taken only 3 days’ data (rain and temperature). This is a sample from the complete data set (population).
When we are not dealing with the complete population, rather a sample, we use (n-1) as denominator in the formula. Note that even if we have 3 datasets, we divided by (3-1) = 2 in the variance, covariance etc. formulas.
Had we used the complete population, we could divide by the actual number of dataset. This correction (dividing by n-1 instead of n) is called Bessel’s correction.
Sample and population measurements also use a different set of symbols to indicate them. For example, sample standard deviation is s while population standard deviation is σ (sigma).
Why did we use the term linear relationship?
The correlation coefficient that we discussed above is called Pearson product-moment correlation coefficient developed by Karl Pearson from a related idea from Francis Galton. This measures the linear relationship. What does that mean?
This essentially tries to draw a line to best fit the two sets of data. The correlation coefficient essentially tells how far the points are from the best fit line.
Let us see how well, the 3 data points that we have worked with so far fit in a line, by drawing a scatter plot using R.
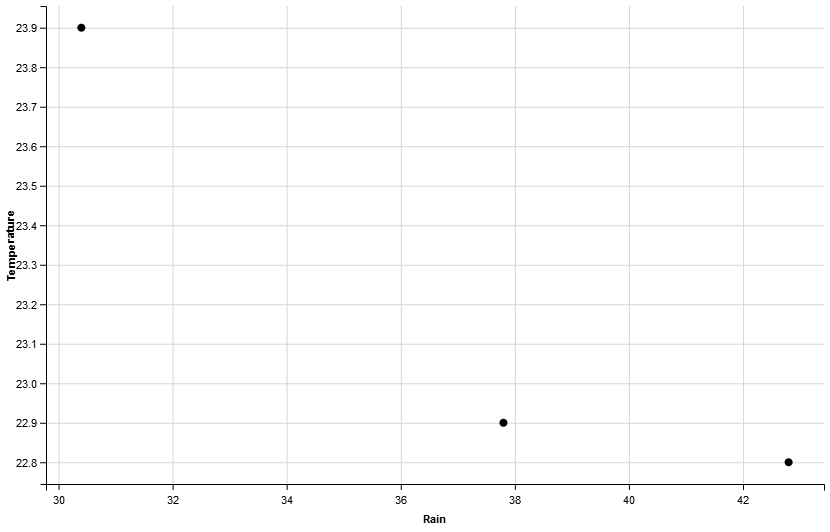
They are fitting in a line quite well (the middle one a bit lower) and that’s why we got a very good negative correlation value, -0.94 (our own manual calculation ignoring some precision might slightly vary if calculated correctly, may be 0.946). How could we get a perfect score of 1? Well, we could get so had they fit in a line in the best way. What does it mean? It means all points should fall on the best fit line. It means, the slope of the line has to be respected by all points. How could we get so? Well, slope = y/x. Suppose the rain points are: 20, 30, and 40. Suppose, we fix the slope at 1.2. Then, the temperature (Y) values have to be: slope * x, that is: 24, 36, and 48 respectively. Let us now compute the correlation coefficient using R.
> vp1 <-c(20, 30, 40) > vp2 <-c(24, 36, 48) > cor(vp1, vp2)
[1] 1
We get a perfect score of 1! Now let us visualize it once again using R.
> dfp = data.frame(vp1, vp2)
> names(dfp)  dfp
 Rain Temperature
1 20 24
2 30 36
3 40 48
> dfp %>% ggvis(~Rain, ~Temperature) %>% layer_points()
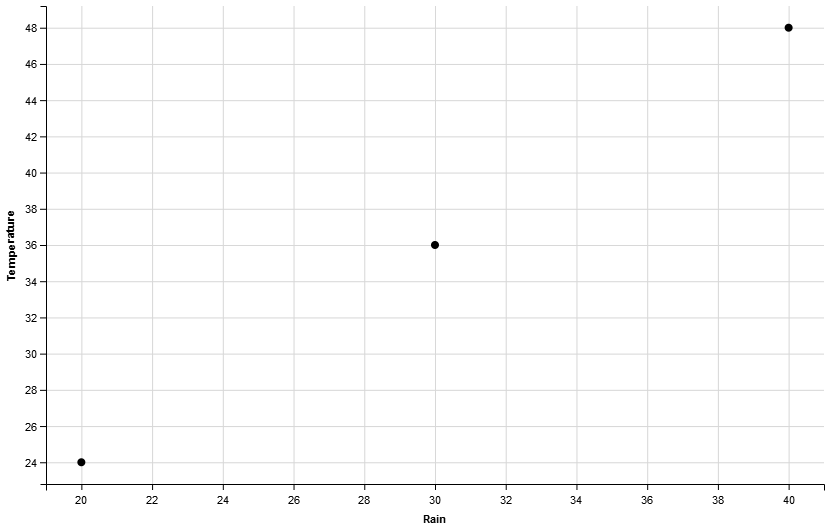
All three points fit in a line. By the way, did you notice the positive and negative correlation in the the two lines shown in the previous two figures?
Expected Value
One final point: in variance etc. calculation we have used average. In some formulas you might encounter expected value E[X]. If all your friends with similar age and experience earning on average 5K per month, would not you also expect your salary to be hovering around the same? Expectation and average are the same in some cases. In this context, when we talked about expected value of a random variable (rain or temperature), expected value, mean and average, all mean the same.
